


1. Turn Foot Traffic into Meaningful Data: In-Store Analytics
Imagine having the same level of insight into your physical location as you do with your website. What if, instead of relying on intuition or sales figures alone, you could actually see how people move through your space, when they arrive, how long they stay, which zones they visit, and whether they come back again?
In the online world, we’ve come to expect detailed analytics as a given. Clicks, scroll depth, bounce rate, time on page – every interaction is captured, measured, and transformed into actionable insight. These metrics help teams optimize everything from content to checkout flow. But walk into most physical environments, such as a retail store, a gallery, a trade event, or even a flagship showroom, and that clarity disappears. Decision makers are left with fragments: a receipt count, a rough guess based on security camera footage, or anecdotal observations from staff.
CountR was built to fill this gap. It empowers organizations to understand and optimize their physical spaces with the same intelligence they apply online. Using your IP cameras and a user-friendly dashboard, CountR collects real-time visitor data that reflects what’s really happening in Your store. It doesn’t just tell you how many people walk through the door. It reveals the behavior of your foot traffic: when people arrive, how long they stay, where they go first, and whether they come back later in the week.
Take a simple example. You operate a home and living concept store. Over time, you notice a spike in footfall on Thursdays between 3 and 5 pm. At first, it seems unremarkable. But when you cross check the data with staff scheduling, you realize this window consistently runs understaffed. You also learn that customers tend to pause longer in one product section, but very few reach the back showroom which happens to house high margin items. With this insight, you adjust the layout to encourage better flow and assign an extra team member during that crucial window. A small operational shift leads to a measurable uplift in engagement and sales.
This is the kind of strategic refinement that CountR makes possible. And it does so without adding complexity. You don’t need a technical background to benefit from it. The system interprets data for you, presenting it in intuitive formats: timelines, and traffic comparisons. You can spot patterns at a glance, measure the impact of a campaign, or compare how different locations are performing, not just in revenue but in visitor retention, and real engagement.
What CountR ultimately delivers is confidence. Confidence to test, to iterate, to justify decisions with data. Confidence to treat your physical location with the same analytical rigor as your digital presence. Because in today’s world, customer expectations are shaped by both. And performance, online or offline, should never be left to guesswork.
2. CountR in Action: Real-World Use
At CountR, we believe that data should not only be collected, but should also solve real world problems: operational inefficiencies, missed opportunities, inconsistent experiences, and guesswork based decision making. The true value of visitor analytics comes to life when organizations use it to act smarter, faster, and more confidently.
Across industries, CountR is helping teams uncover patterns they couldn’t see before. Below are just a few of the ways our clients are turning foot traffic into actionable insight.

Retail and Concept Stores
For retailers, CountR reveals the invisible dynamics of the customer journey. One fashion brand, after installing CountR across a dozen stores, discovered that a surprising 23 percent of their daily traffic entered during a previously overlooked mid morning time slot. Sales didn’t reflect this spike, so they adjusted staffing accordingly, assigning more experienced floor staff to those hours. The result was a 31 percent increase in conversion during that window.
Retailers also use CountR to identify underperforming zones inside stores, monitor engagement during promotional campaigns, and test new product placements. A home goods retailer used CountR’s flow data to identify a bottleneck near their seasonal display, which was quietly preventing customers from reaching a high margin section of the store. A simple reconfiguration of fixtures dramatically improved flow and visibility.

Shopping Centers
Malls and multi tenant venues rely on CountR to understand the push and pull of their layout. Anchor tenants often attract the most attention, but foot traffic data can reveal smaller retailers that perform better than expected in terms of engagement or dwell time. Leasing teams use these insights to negotiate contracts, and optimize layout. In one case, a shopping center adjusted signage and entry flow after learning that nearly 40 percent of visitors were clustering around only two of six possible entrances.

Museums and Cultural Venues
Cultural institutions face a unique challenge: engagement isn’t always transactional. CountR helps museums and galleries understand which exhibits attract and hold attention, how long visitors linger, and where drop off points occur. A museum using CountR found that a highly promoted temporary exhibit saw great initial traffic but poor retention. Deeper analysis revealed that signage was inconsistent, leading many visitors to skip the final rooms altogether. A minor tweak in visual cues increased full exhibit completion rates by 27 percent.

Event and Experience Spaces
Temporary environments like pop ups and brand activations often lack the time to iterate. CountR gives these spaces real time insight into what’s working and what isn’t. A global electronics brand used CountR at a multi-city product launch tour. By comparing visitor engagement metrics city by city, they optimized their booth setup and staffing strategy midway through the tour, boosting average dwell time and lowering visitor drop off by the final leg.
These are just a few examples, but the principle is constant. When you can see what’s happening in your space, you can make it better. CountR makes physical environments more measurable, and therefore more manageable.
3. Feature Deep Dive: What You Can Measure with CountR
Understanding your physical space starts with asking better questions. When are people coming in? How long do they stay? Which areas are most engaging? How does campaign activity influence traffic? And how often do people return? CountR is built to answer these questions in clear, actionable ways.
Rather than overwhelming you with raw data, CountR focuses on the metrics that matter most and translates them into meaningful insights through a simple, intuitive interface. Here’s how it works.
 Real Time Visitor Counting
CountR gives you a live view of foot traffic across all your monitored locations. Whether you’re tracking a single entrance or multiple zones, you can see how many people are in your space right now and how that number changes throughout the day.
 Peak Hour and Traffic Patterns
With time stamped data, CountR shows you not just how many people visit, but precisely when. This lets you identify peak traffic hours, daily rhythms, and seasonal trends. These patterns help businesses schedule staff more efficiently, plan campaigns at the right times, and avoid costly blind spots in coverage or inventory.
 Historical Reporting and Trends
Beyond daily operations, CountR builds a valuable historical archive. You can track performance over weeks, months, or seasons. This is especially powerful when comparing campaign periods, understanding post launch traction, or planning year on year improvements.
 Campaign Effectiveness
Did your last promotional push actually drive more people into the store? CountR lets you correlate marketing campaigns with footfall spikes. You’ll see what worked, what didn’t, and how long the effects lasted. It’s like closing the loop on your offline campaigns, finally connecting physical outcomes to your promotional effort.
 Visitor Demographics
CountR can anonymously estimate basic demographic profiles, such as age range and gender distribution. These insights help brands tailor messaging, displays, and product positioning to better match the people who actually show up, not just who you think your audience is.
 Returning Visitor Tracking
Understanding new versus returning visitors is crucial. CountR identifies repeat footfall, helping you measure brand loyalty, community engagement, or the impact of long term experiential elements. If your goal is to build relationships and retention, this metric is a key indicator.
 Staff Exclusion and Data Integrity
Reliable data depends on clean inputs. CountR automatically filters out staff movements to avoid inflating visitor counts. The result is more trustworthy analytics, without the need for manual correction.
Together, these features provide a full spectrum understanding of your physical environment. CountR doesn’t just count people. It reveals behavior, preference, timing, and patterns. And that means smarter decisions grounded in reality, not assumption.
5. From Data to Decisions: Why CountR Isn’t Just a Footfall counter
In many organizations, analytics are treated as a tool, something to be checked periodically, analyzed retrospectively, or used to validate a hunch. But in practice, data only delivers real value when it is embedded into the way teams think and operate. That’s where CountR stands apart. It’s not just a source of numbers. It’s a catalyst for sharper decisions, and more confident planning.
The CountR dashboards are designed not for data scientists, but for decision makers. Instead of burying users in complexity, it surfaces trends, anomalies, and opportunities that matter. What’s your peak hour today? How many first time visitors came this week? Did that new layout increase dwell time? These are the kinds of questions CountR answers in moments, helping teams respond in real time, not after the fact.
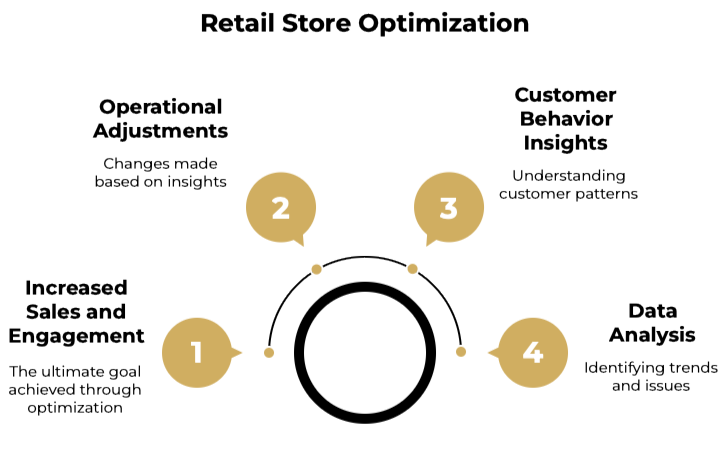
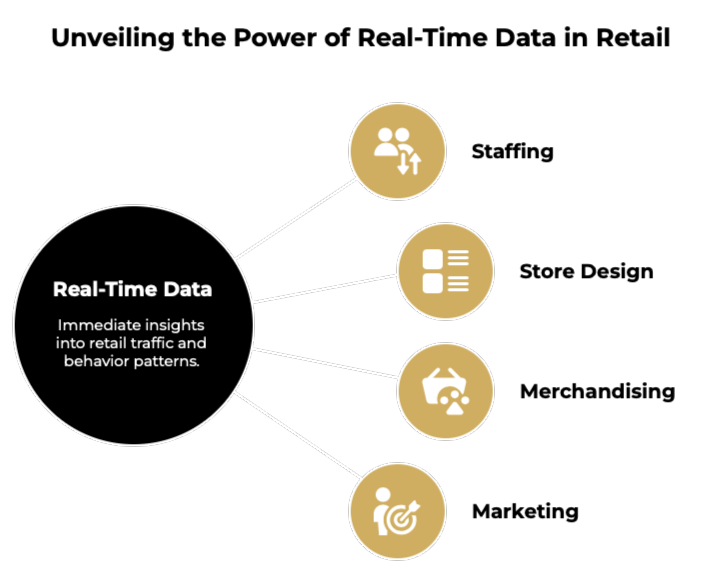 Take a retail operations manager. Instead of waiting for end of week sales reports to guess at traffic quality, they can open CountR and immediately see when visitor numbers spike, where bottlenecks form, or which sections people tend to avoid. That information isn’t just interesting. It drives action. It informs staffing. It shapes store design. It refines merchandising.
Or consider a marketing lead preparing for an in store campaign. CountR gives them visibility into how previous initiatives influenced traffic and behavior, so they can time promotions with confidence, choose strategic placements, and set performance benchmarks based on historical reality rather than assumptions.
This is where the power of operational intelligence becomes clear. CountR’s impact doesn’t come from the complexity of its metrics, but from the clarity it brings to decisions. The platform turns passive observation into active insight, helping teams shift from reactive problem solving to proactive optimization.
Just as website analytics revolutionized digital marketing and e-commerce, visitor analytics is now reshaping how physical environments are managed. From strategic planning to day to day execution, CountR helps teams ask better questions, make smarter decisions, and align every part of the customer journey with intention.